Attempting to Forecast UK Inflation
More questions than answers

The UK economy is experiencing a rate of inflation that has not been seen in a long time. In the 12 months up to May 2022, consumer prices increased by 9.1% – the highest rate in 40 years. There has been much speculation as to what has caused this unfamiliar dalliance with inflation: the significant bout of monetary stimulus during the pandemic, the supply problems faced globally as the world re-opened, and of course, the spike in energy prices exacerbated (but not solely caused) by Russia's invasion of Ukraine and the subsequent economic sanctions imposed by many nations. Performing an autopsy of inflation is no doubt an interesting exercise, but the question many would really like answered is what will happen next. Will this inflationary period have more in common with the 1990s, when it peaked at a little over 9% and disappeared within a couple of years? Or could it be more like the 1970s, a decade defined largely by rampant and sustained price instability that featured an inflation rate of 26% at one point?
As economists are often inclined to do, I will use a model to try and make some kind of informed prediction. The model I will use is the basic three equation New Keynesian model with a real rate rule replacing the standard Taylor rule specification of monetary policy. The technical reason for this is that the real rate rule ensures determinacy for all possible parameter configurations, which is not true for the Taylor rule specification. I am currently working on a paper with my supervisor Franck Portier and Paul Beaudry where we discuss this point in more detail. The model is by no means the most complex of macroeconomic models. In reality, central banks will use models with many more bells and whistles when they conduct their forecasts. Still, the model’s simplicity makes its results easy to interpret and it embeds the key mechanisms that are present in larger-scale models. Do not take the forecasts too seriously as a result, but I view them as a decent benchmark. The three equations in the model are as follows:

Y is the output gap, R is the real interest rate (the nominal rate minus expected one-period ahead inflation) and π is inflation. D is a demand shock, Z is a supply shock, and M is a monetary shock. The parameters β and γ are the subjective time discount rate and coefficient of risk aversion respectively but these are not important for our purposes here and are calibrated not estimated. The parameter κ is the slope of the Phillips curve and is crucial since it determines how changes in the output gap feed back to inflation. Finally, the two φ parameters capture how monetary policy responds to supply and demand shocks.
I estimate the simple model on UK data from 1960 - 2022. This is a little problematic since this period includes the pandemic, which most likely represents a structural break in the time series of the macro variables, so once again take all of this with the necessary degree of caution.
Result 1: The model ascribes the current high inflation to supply shocks rather than demand shocks.
The figure below plots the historical decomposition of inflation from the estimated model:

If we look at the far-right side of the graph, we can see that negative supply shocks (green bars) are putting upward pressure on inflation, but this is actually being mitigated slightly by the impact of negative demand shocks (blue bars). This result is in line with popular wisdom that European inflation is primarily supply-driven and is different to the 70s (periods 40 to 80 on the graph), where both supply and demand shocks were pushing inflation upwards. However, there is no evidence to suggest that the response of monetary policy during the pandemic has had a large impact on inflation. I estimate that, over the sample period, 83% of inflation was explained by demand shocks, 16% by supply shocks, and 1% by monetary shocks, and so this current bout of inflation is somewhat unusual in its cause.
Result 2: The model estimates a flat Phillips curve.
The second notable result is that the estimate of the Phillips curve slope is 0.004, so extremely close to zero. The implication of this is that changes in the output gap have a pretty muted impact on inflation, all else equal. This finding of a flat Phillips curve is what we also see in our paper for the US, and is what Hazell et al. (2021) find in their work using regional data. A pet peeve of mine is when people plot a graph of inflation against the unemployment rate and try to use this to draw inferences about the slope of the Phillips curve (see here for example). This ultimately tells you nothing about the underlying structural parameter, since both inflation and unemployment/output are endogenous variables that are determined simultaneously in equilibrium. McLeay and Tenreyro illustrate this nicely and show that the slope of the best fit line plot of inflation against unemployment is consistent with any underlying parameter, and actually says more about the parameters of monetary policy than it does about the Phillips curve. We can simulate 2000 periods of data from the model and produce a plot of this sort. As we can see, the plotted Phillips curve implies a relatively steep relationship between inflation and the output gap (the slope coefficient is 0.2) despite the structural parameter being very close to zero.

Result 3: The model does not forecast a large increase in inflation or a recession, but there is a lot of uncertainty.
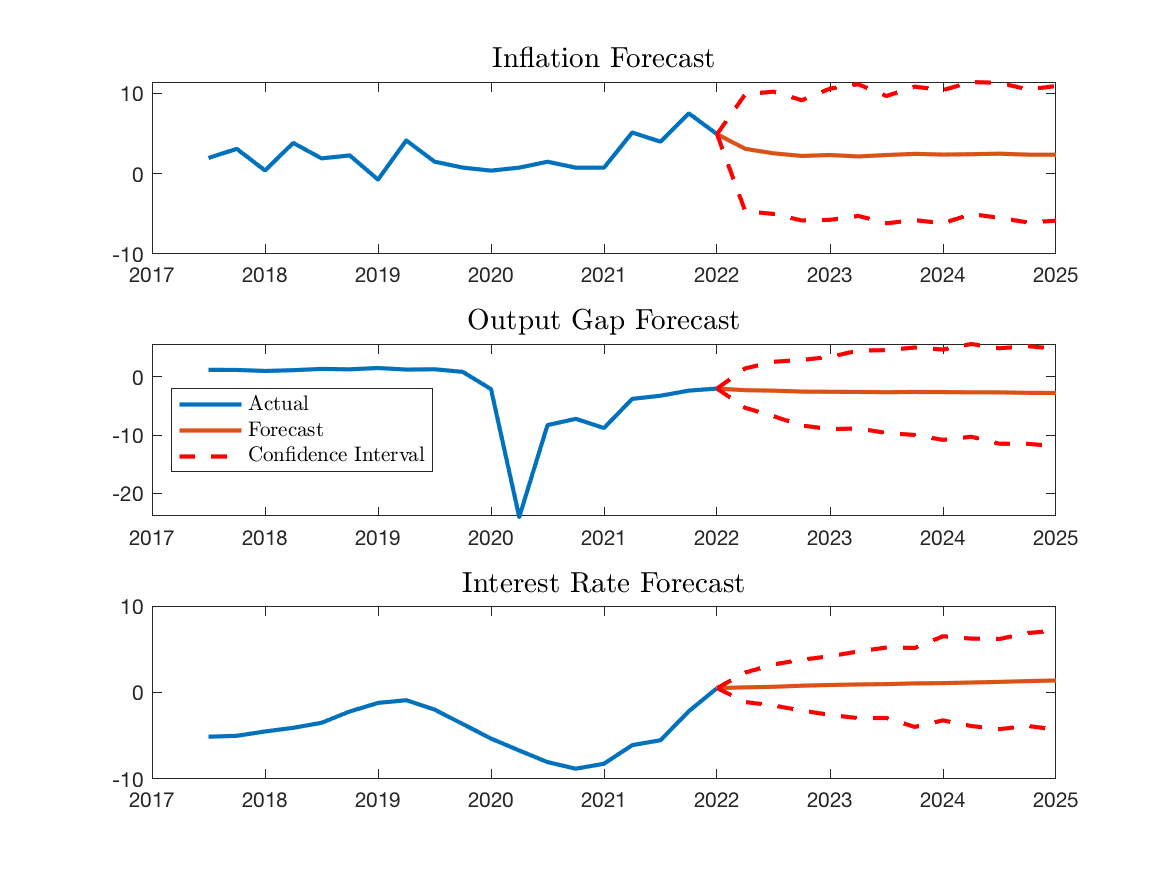
Next, I use the model to produce a forecast of inflation, the output gap and the nominal interest rate, which is plotted below. The model's point estimates do not foresee a large increase in inflation, although the confidence intervals are wide and include this outcome. This speaks to a key property of inflation: it is incredibly hard to predict. This is something which economists have written about for a while now, for example, most famously in Atkeson and Ohanian (2001). Here, the authors find that a random walk model – where the forecast for inflation next year is inflation over the last year – is able to outperform many Phillips curve models in terms of predicting inflation. Historically there has been strong mean reversion in inflation, and since we can only estimate the model with past data, this will end up being baked into these forecasts. Whether or not this current shock closely resembles past shocks is certainly an open question for which time will tell.
Result 4: Monetary policy might not be able to do that much to reduce inflation.
Because we estimate such a flat Phillips curve, an increase in the nominal interest rate via a change in monetary policy may have quite a limited effect on inflation. The mechanism is roughly as follows: a rise in the interest rate causes a fall in output from the Euler equation (first equation), which causes a fall in inflation from the Phillips curve equation (second equation), with the magnitude of this decrease determined by κ. Since I estimate a very flat slope, this result implies that a very large interest rate rise would be required to bring inflation down. We can see this in the impulse response functions estimated from the model for a monetary shock that raises the interest rate by 0.25 percentage points:

The shock reduces inflation by about 0.35 percentage points, meaning the elasticity is around -1.5. With inflation at 9% and to get it back down to the target rate of 2%, this back-of-the-envelope calculation would imply that the Bank of England would need to raise interest rates by around 4.70 percentage points. This would be a hugely contractionary shock, as the response function of the output gap tells us, and would require a large recession. Because the inflation is coming from a supply shock which will eventually dissipate, the model forecast above does not foresee a large rise in interest rates in the future. Supply shocks are problematic for monetary policymakers. We typically think of a Central Bank as having two objectives: to stabilise output/unemployment and to keep inflation near a target rate (2% for the Bank of England). Since supply shocks push output and inflation in opposite directions, they force the Central Bank into a tradeoff between the two. This can explain why this current situation poses such a headache for policymakers as they are facing a dilemma. A flat Phillips curve mitigates this substantially, though, since it dramatically limits the ability of monetary policy to influence inflation.
Things I have Enjoyed Reading/Watching Recently
Very sad news about the assassination of Shinzo Abe. He was a leader who was able to facilitate the reverse of Japan's stagnation, which seemed impossible at times. A great piece from Noah Smith, who was an Abe convert, on his impressive achievements as the Japanese Prime Minister.
A very nice paper on the permanent shock to commercial real estate from Arpit Gupta, Vrinda Mittal and Stijn Van Nieuwerburgh. Blog post summary here. The consequences of this permanent decline in the price of this asset class has not fully been realised.
The Rest is History has quickly become my favourite podcast. The five part series on the US civil war is fantastic and highly recommended.
This podcast with Gregory Clark talking about his research on long-run intergenerational mobility. I will write more about this topic at some point, since it is no exaggeration to say that Clark's work has totally changed some of my world views.
School closures were an absolute disaster for kids, who could have possibly predicted this? This policy will undoubtedly go down in infamy.
Top Gun Maverick has now passed the $1bn mark at the global box office, which is fully deserved since it is excellent. It also is good news for the cinema industry, which many had written off during the pandemic.
"Across 21 countries, the left has lost most support among low education, high-income voters. Left gained most among high education, high-income votes, but only reached parity there. So left support is now concentrated among high education low-income voters". From Matt Grossman on Twitter.
Britain is very much in the midst of a lost generation. Reversing the productivity stagnation should be the main focus of the Conservative leadership contest, since everything else is of second-order importance in comparison:

Lead actors in films are getting older, from Patrick Collison on Twitter:

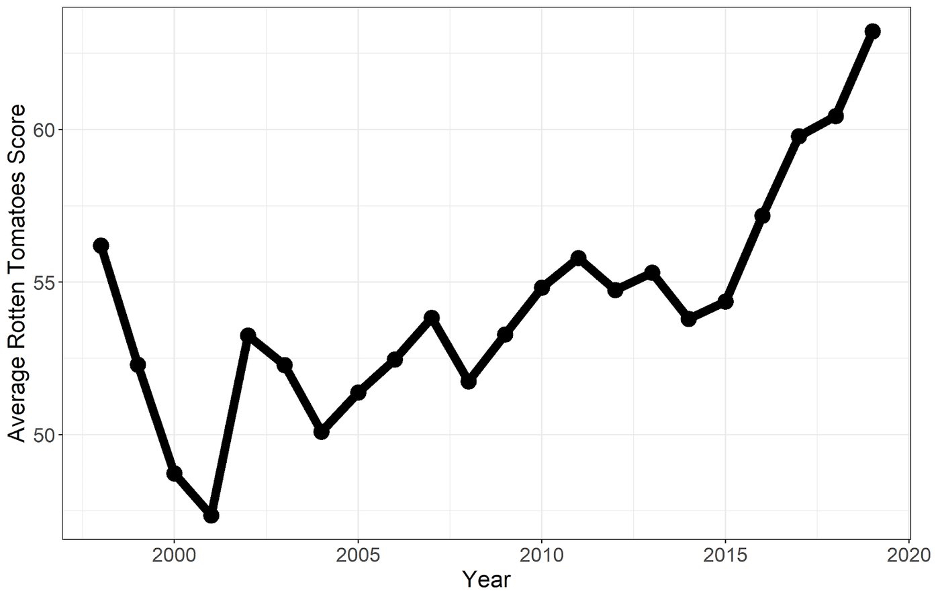
Rotten Tomatoes score inflation since 2015