

How Did Epidemiologists Get It So Wrong? Part 2 of 3

In my last post, I outlined the three key mistakes that I believe epidemiologists have continued to make throughout the pandemic:
1. Over-estimation of the impact that policy has on the dynamics of the pandemic.
2. Lack of emphasis on non-policy induced behavioural change as a mechanism of transmission reduction.
3. Exaggeration of confidence levels when making forecasts.
I covered the first of these in my previous post, and I will cover the second today. I originally planned to cover both of the other points here but it ended getting a bit long so I will split this series into three parts rather than two.
2) Lack of emphasis on non-policy induced behavioural change as a mechanism of transmission reduction.
A common, perhaps even dominant, narrative in the UK is that in March 2020 the pandemic was getting out of control before the government locked down, which then led cases to decline subsequently. I will argue here that at worst this is false and at best there is no definitive evidence to support it. Instead, the data is more supportive of the view that cases were falling well before the lockdown was announced and implemented – most probably due to spontaneous behavioural change in response to the changing information about the scale of the problem. March 2020 was such a crazy time that it is easy to forget that many businesses moved to remote working well before the nationwide lockdown. People were so scared of Covid that many voluntarily reduced their number of contacts, eschewing large social gatherings and in some cases bunkering down in their homes completely. I will try to show that these voluntary measures likely had much more impact than the lockdown did. In fact, I will argue that this pattern of cases falling prior to lockdowns has been common internationally throughout the pandemic and that countries such as Sweden still experienced peaks and declines in cases despite not locking down.
First, it is necessary to consider the complex dynamics between the number of Covid infections, government policies and people's behaviour. The essential problem for an econometrician trying to parse out the contribution of policy to case dynamics is that both behaviour and policy respond to increases in cases in a simultaneous manner. As cases increase, a government becomes more and more likely to impose non-pharmaceutical interventions (NPIs) such as lockdowns, but at the same time, people become more and more likely to curtail their number of contacts. As such, a lockdown is likely to be imposed at the same time that people drastically change their behaviour, potentially causing a naive observer to erroneously conclude that the lockdown was responsible for the R-value dropping below 1.
In an ideal world, we would be able to hold behaviour constant while only varying policy to assess its impacts, but this is obviously completely impossible. Sweden, however, provides a case where government policy was held pretty much constant while only behaviour changed, allowing us to plausibly assess the role of behaviour in exerting downward pressure on the pandemic. Many epidemiologists, both in their academic work and their policy recommendations, still continue to place far too little emphasis on the role of voluntary behavioural change. As a particularly egregious example, this paper by Flaxman et al. (2020), which was published in the prestigious journal Nature and at the time of writing has over 2000 citations, develops a model to try and assess the impact of NPIs on the pandemic across different countries. Their headline finding, which received much media attention, was that lockdowns saved over 3 million lives in Europe. Crucially, however, in the model it is solely NPIs that can have any influence on cases, i.e. behavioural variation is conspicuously absent. Of course, if the model can only ascribe declines in cases to NPIs, it should be completely unsurprising that this is what it ends up finding! I recommend this blog post, which digs deeper into the myriad of other problems with this paper. To name just one other, to explain the dynamics of Sweden, the Flaxman model ends up finding that banning public events in Sweden was something like 50x more effective than on average in other countries. This is just completely implausible and goes to show that the model is completely unfit for purpose. It represents a classic case of the 'garbage in, garbage out' doctrine.
Taking a much less assumption-based approach, I will simply attempt to infer the number of cases in the UK during the first wave and examine their dynamics relative to policy changes. To do this, I will use data on deaths since this is far more reliable than cases data as testing was not readily accessible at this time. The methodology is borrowed from Philippe Lemoine's blog post. For each death, I use the infection-to-death distribution (log-normal with a mean of 26.8 days and standard deviation of 12.4 days) in this paper to simulate when the corresponding case likely occurred. Then, using an estimated IFR of 1%, I can again use a Monte Carlo simulation with a geometric distribution to work out how many cases there likely were on each day. I repeat the simulation a large number of times to get uncertainty bands. The figure below presents the estimated number of daily cases in the UK during the first wave. The dotted line represents the date of the nationwide lockdown, and the plot clearly shows that there was a flattening in cases, perhaps even a decline, before the lockdown came in. As such, it is hard to argue that the lockdown had a huge transformative effect. The results are consistent with it having no effect (cases may have dropped regardless) or having some effect (the plateau may have lasted much longer), ultimately it is not possible to tell since we do not know the counterfactual. Either way, the lockdown was not responsible for cases beginning to plateau since this occurred beforehand. Another puzzle for the lockdown-centric framework arises from the lack of a rebound when restrictions were lifted at the start of July. I think this can once again likely be explained by people displaying cautious behaviour.

The UK's Autumn lockdown seems to have been even less effective:

The next figure plots the results of this same exercise for a handful of other European countries. Case dynamics are now all over the place relative to the timing of lockdowns. In Italy lockdown occurs around the peak, in Belgium cases continue to rise for another week after lockdown is imposed, and in Spain, cases are falling well before the lockdown begins. This is not great news for the Flaxman view that lockdowns are the main driver of case growth reversals.

I am well aware that other NPIs were imposed before lockdown in most of the countries, and I am sure these probably have non-negligible impacts, but the Flaxman view is that lockdowns are the only sufficiently effective NPI and this is what I am contesting here. To illustrate what this view would predict, I simulated a pandemic in the workhorse epidemiological SIR model. For the first 8 weeks, the reproduction value (R) is at its natural value (R0), which I set at 2.7 for Covid. Then, for the next 4 weeks R drops to 1.8 as some mitigations are taken. Finally, on day 63 a lockdown is implemented which pushed R below 1 to 0.8. The plot below displays the dynamics of new cases in this simulation. Clearly, the peak coincides exactly with when lockdown begins, in contrast to what we see in the data.

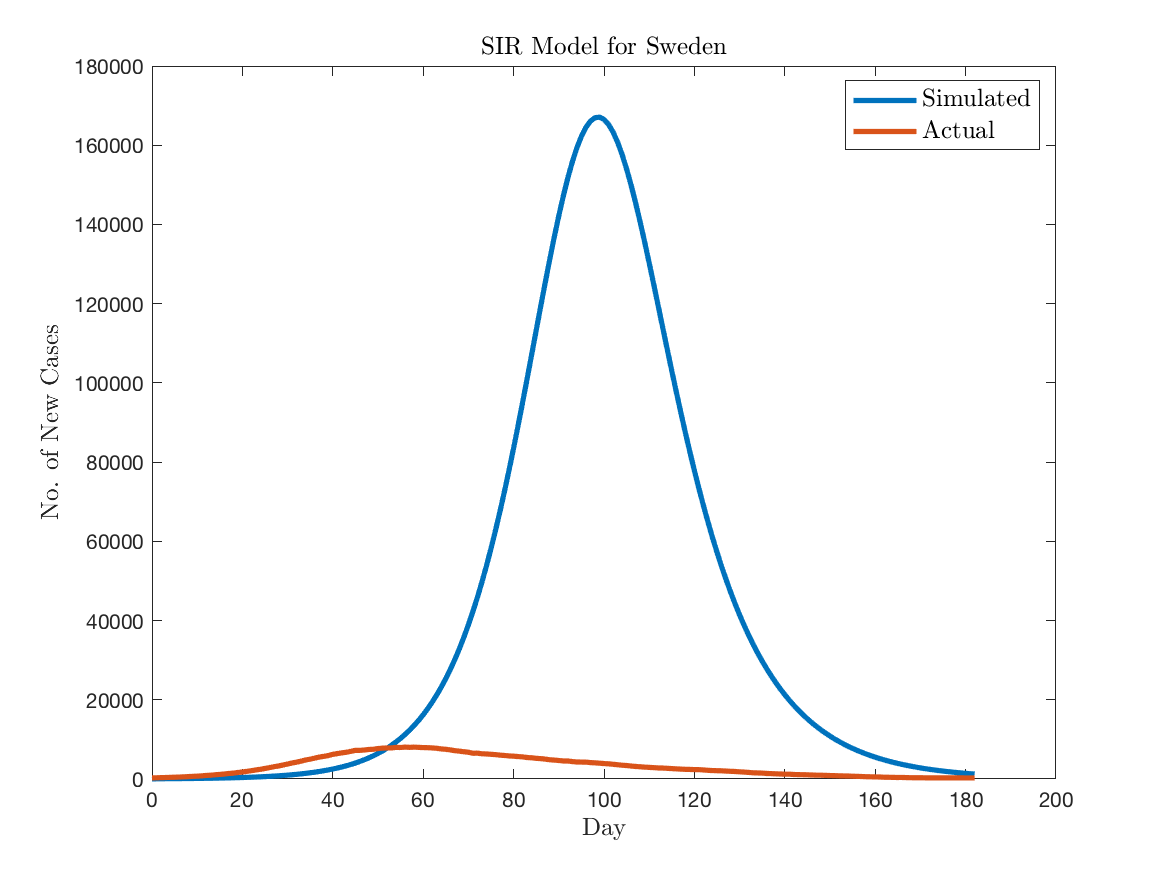
As I mentioned, Sweden poses a severe challenge for the lockdown-centric view also, mainly because they never had a lockdown and yet cases peaked well shy of the herd immunity threshold. To illustrate this, I used the SIR model to simulate the pandemic for Sweden. I assume that the effect of the sparse number of mitigations Sweden implemented (banning large events, guidance to avoid travelling within the country) reduced the R-value from 2.7 to 1.8. The plot below compares the simulated number of daily cases to the actual number inferred from death data. The SIR model overpredicts the peak by an almost comical factor – 160,000 new cases per day in the model vs 8,000 in reality. The lack of any kind of behavioural change in the standard epidemiological model means that there is no automatic stabiliser applied, and this results in the huge overestimate of infections. In reality, Swedish people most likely undertook sufficient behavioural change in response to increasing cases, hospitalisations and deaths to result in the R-value going below 1. No lockdown was necessary in order to achieve this.
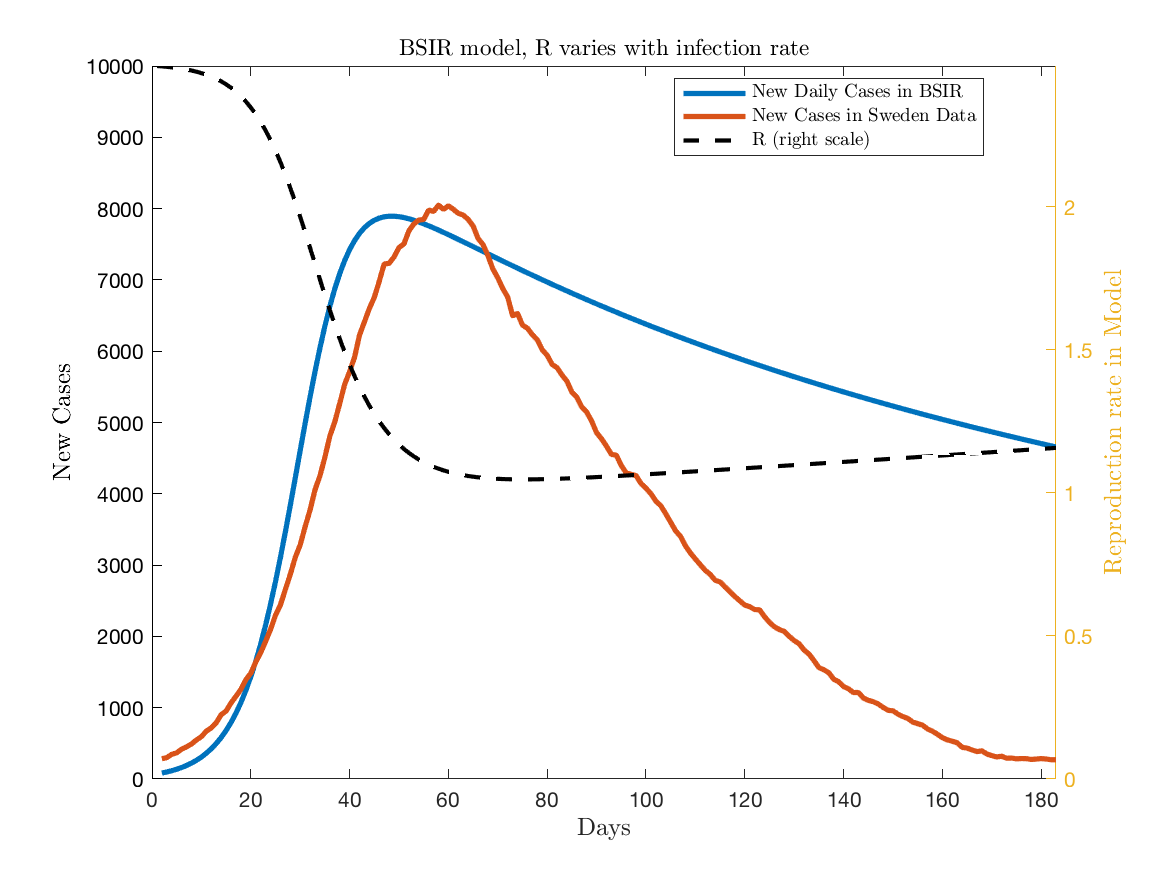
To formally model the idea of behavioural change, I will use the behavioural SIR (BSIR) model that John Cochrane developed in this blog post. The fundamental idea is that as the number of infections increase, people reduce their average number of contacts which then, in turn, reduces the R-value and the virus spreads less quickly. The below figure plots the results of a simulated pandemic in this BSIR model vs the cases inferred from the Swedish death data. The model does a pretty good job at matching the increase in cases and then the timing of the peak. In the model, however, R asymptotes towards 1 and so it does not do a good job of explaining why cases actually ended up declining so quickly. I think it could definitely be developed further though.
To be clear, I am not arguing that lockdowns had no effect on transmission. I think this argument is quite implausible. What I am saying is that the effects were small relative to the counterfactual where most people would likely have voluntarily adjusted their behaviour and cases would have declined. Quantitative models which don't feature this endogenous behavioural change are fundamentally flawed and will vastly overstate the impact of lockdowns and other NPIs. Lockdowns are the bluntest of blunt instruments, as they prevent both risky and riskless activities. In my opinion, people are intelligent enough to make the distinction for themselves when making behavioural decisions. Given the enormous cost in terms of civil liberties, I think it is unlikely that lockdowns would pass a cost/benefit test. Admittedly this is a very hard exercise to perform accurately, however, as there is an enormous number of factors to consider.